Ctrl+Shift+D) with the entry the setup wizard created. Everything below needs a connected debugger.
Breakpoints and stepping
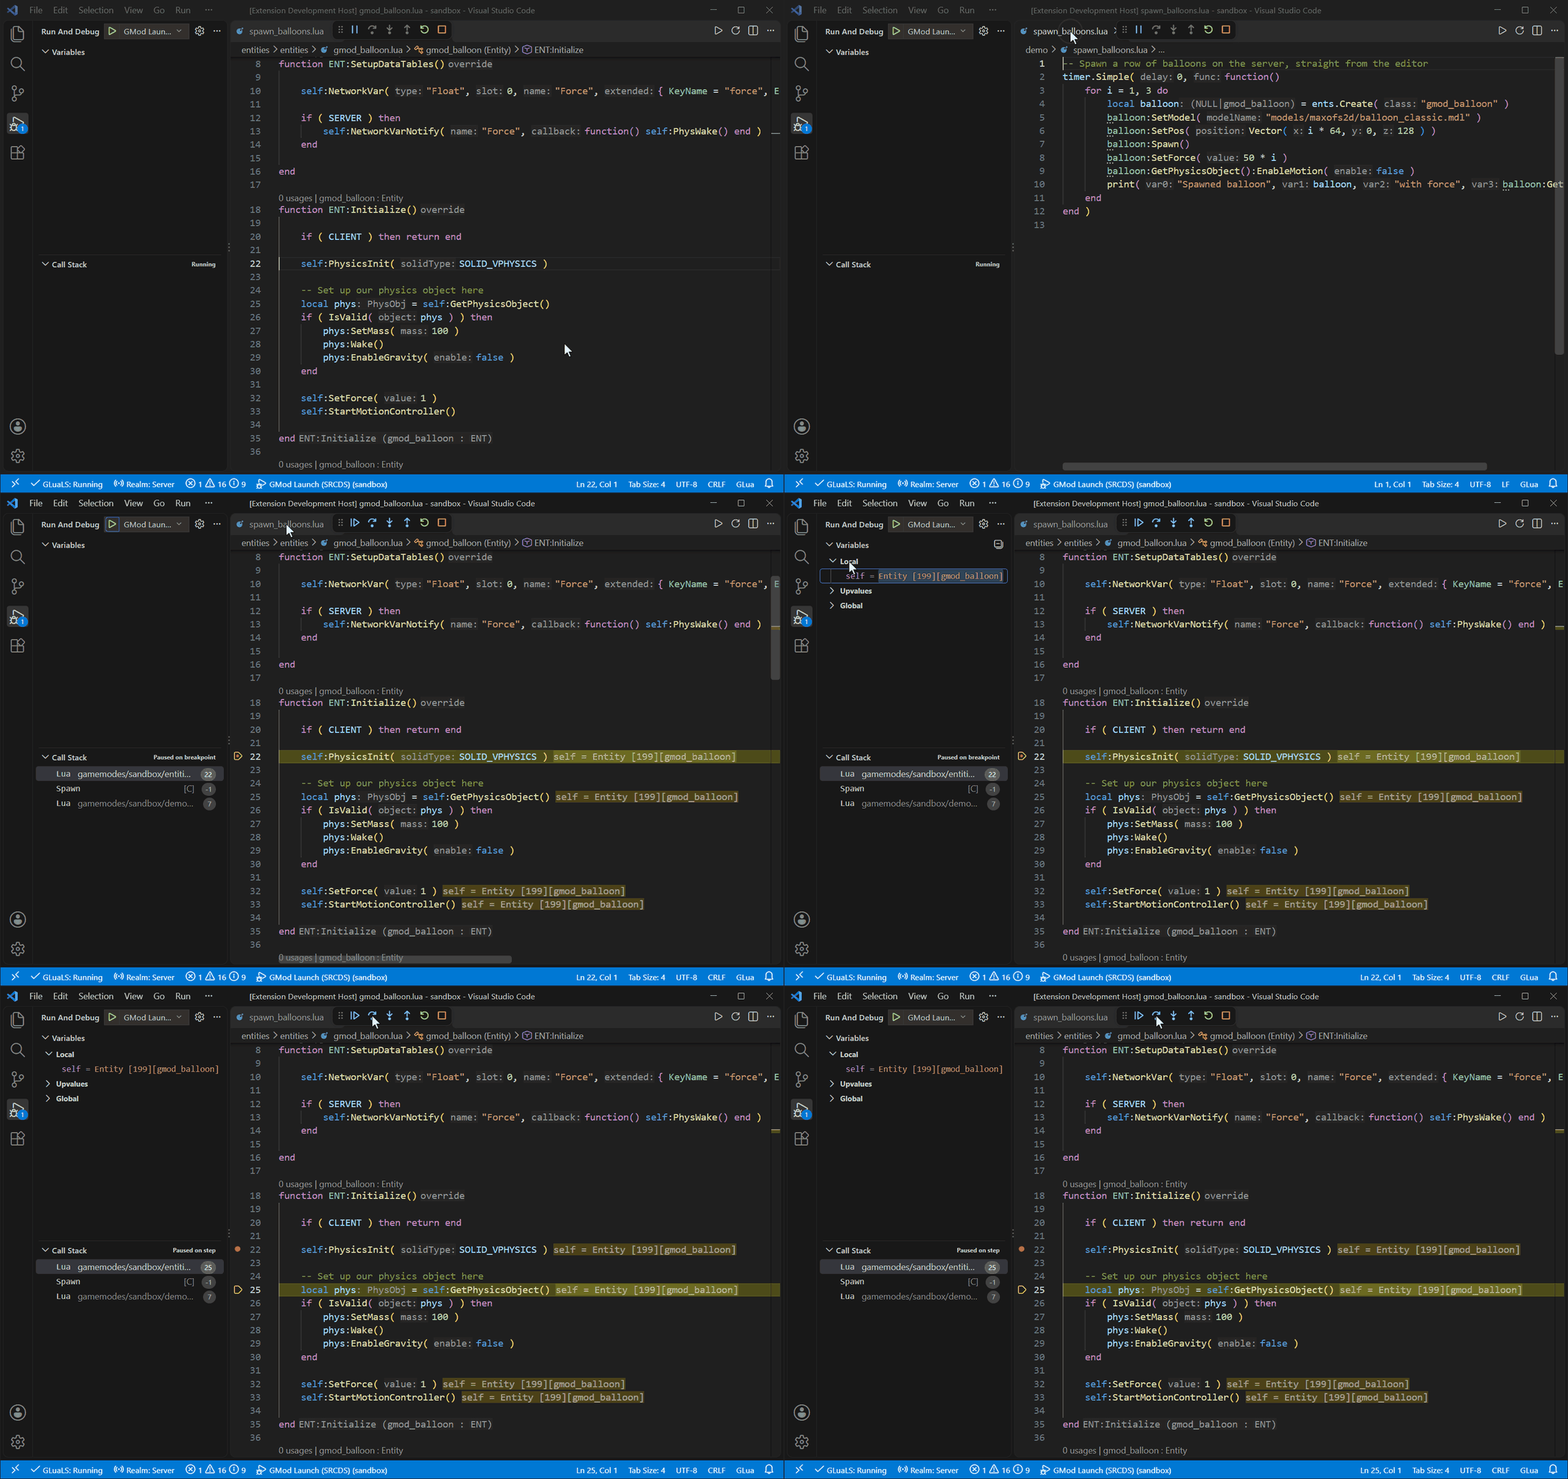
The debugger works like any other VS Code debugger:- Click left of a line number to add a breakpoint.
- Right-click a breakpoint and choose Edit Breakpoint to add a Lua condition, such as
ply:Health() < 10, or a hit count. - Step with
F10(over),F11(into) andShift+F11(out), and continue withF5. - While paused, the Variables panel shows locals, upvalues and globals. Double-click a value to change it.
- Type Lua in the Debug Console (
Ctrl+Shift+Y) to run it where the code is paused, with access to its local variables.
Run Lua on the server or client
While connected, you can run code without leaving VS Code:
Code runs in the realm shown as Realm in the status bar. Click it to switch between server, client and shared. Client code runs on every connected player.
Errors view
The Errors view in the Run and Debug sidebar collects Lua errors from the game while the debugger is connected. Repeated errors are grouped with a count. Click a stack frame to open that line in your code. Use Clear to empty the list.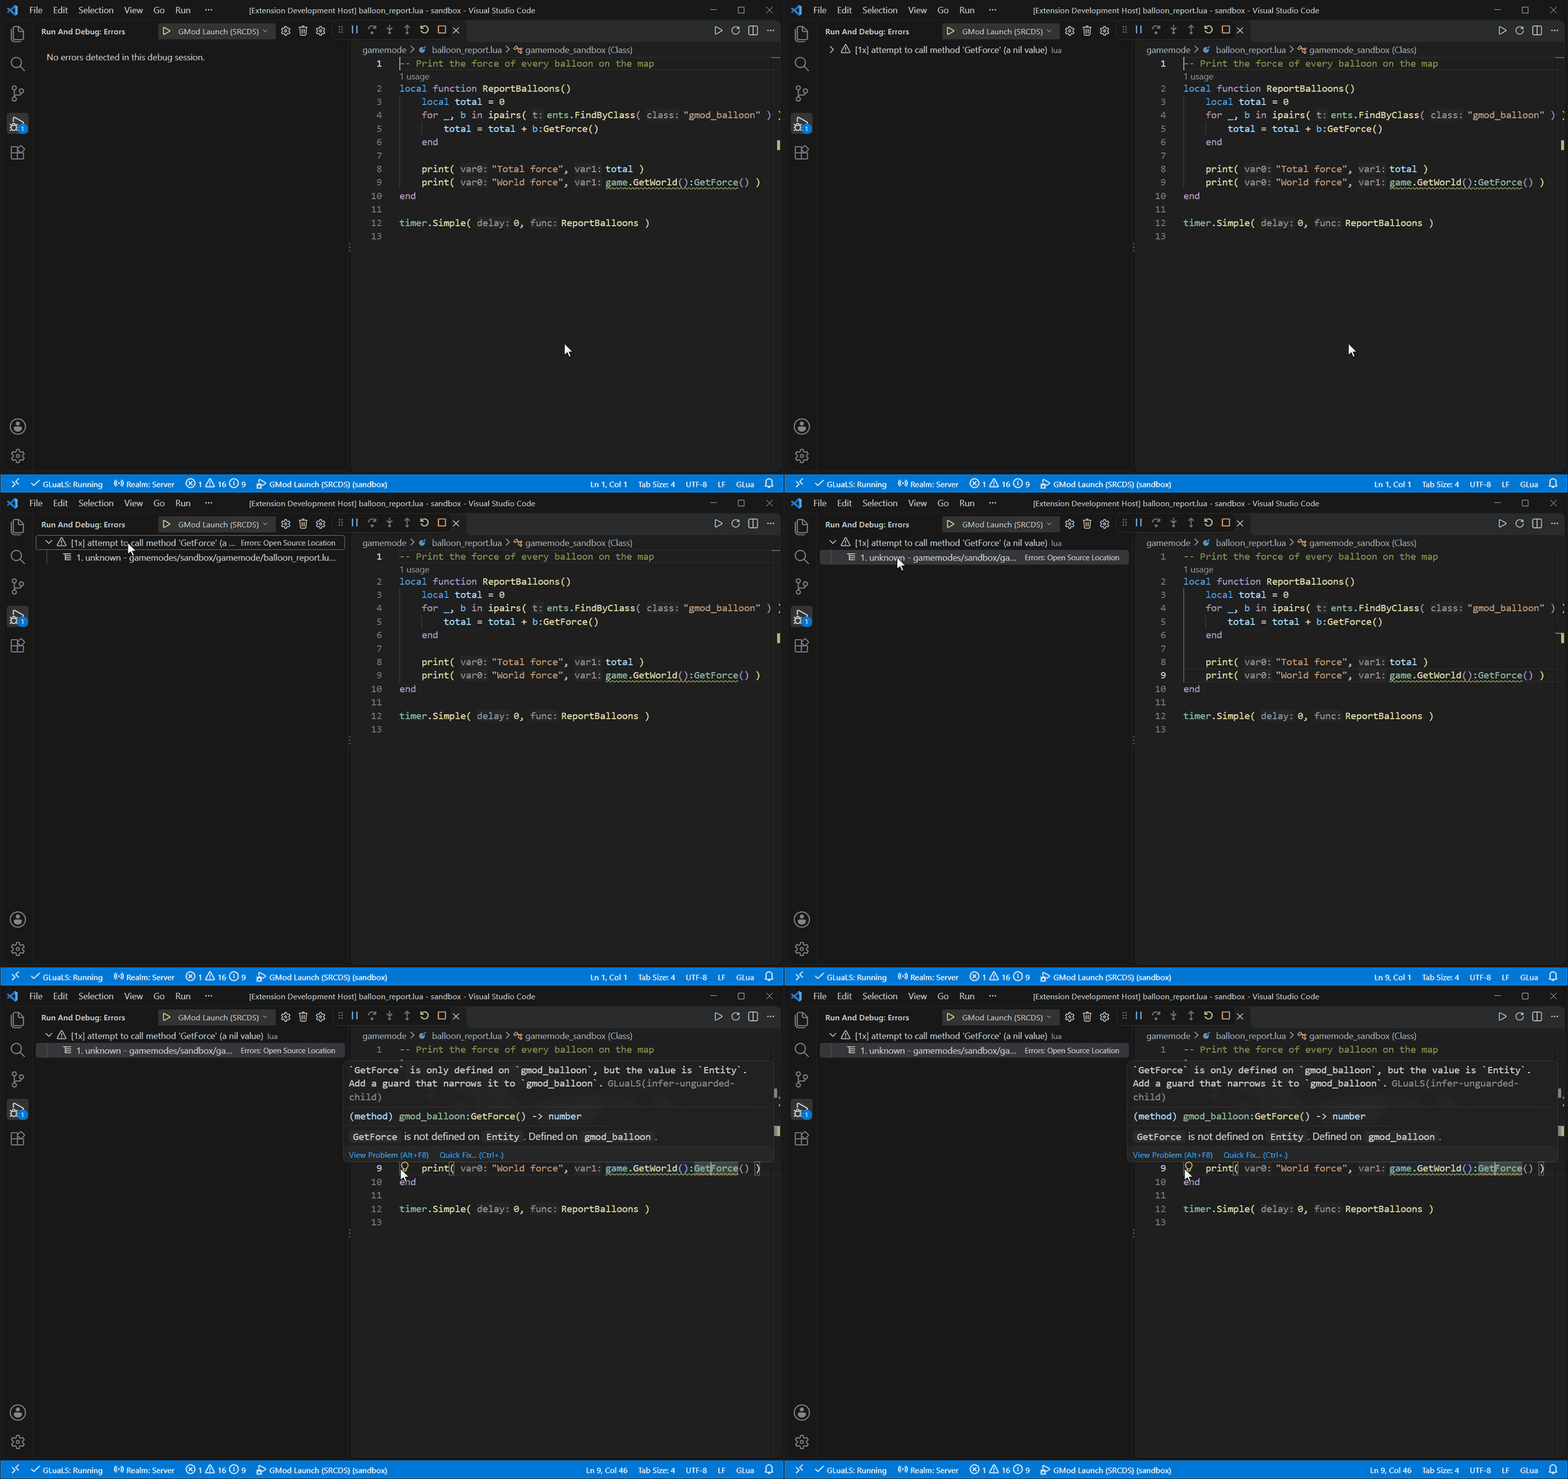
"stopOnError": true in launch.json. This also pauses on errors from other addons.
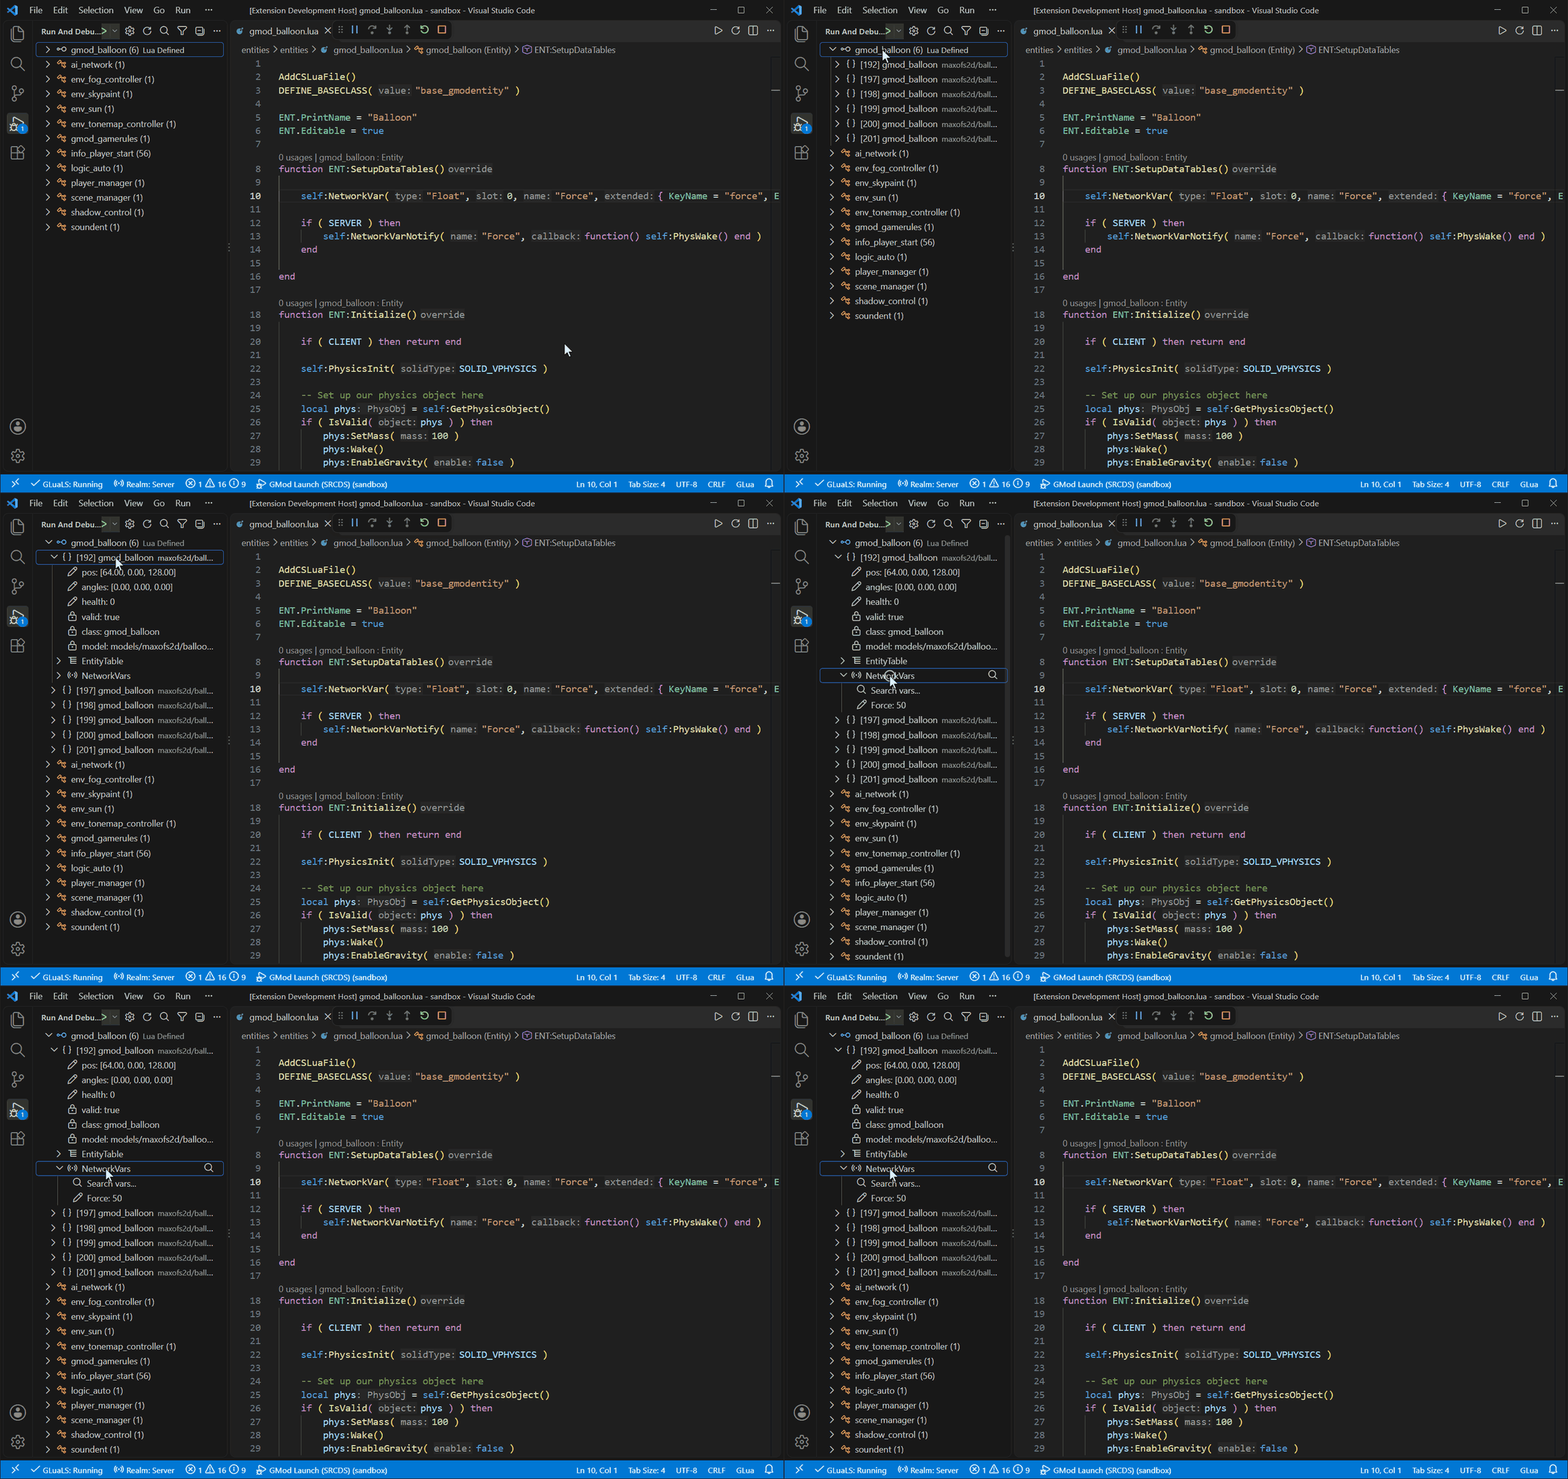
Entity Explorer
The Entity Explorer in the Run and Debug sidebar lists every entity in the game. Expand one to see its NetworkVars and table values. Use the toolbar to filter by type (players, Lua entities, others) or search names and values. While the debugger is paused, click a value or its pencil button to change it.